Making simple changes with the brightness and contrast controls
Each graph has brightness and contrast controls you can use to make simple changes to a component:
- The brightness control is a line running across from the leftmost point of the graph. It is initially at the bottom of the graph.
- The contrast control is a line running across from the rightmost point of the graph. It is initially at the top of the graph.
To use these controls, drag the line up or down. For example, to increase the red component's brightness:
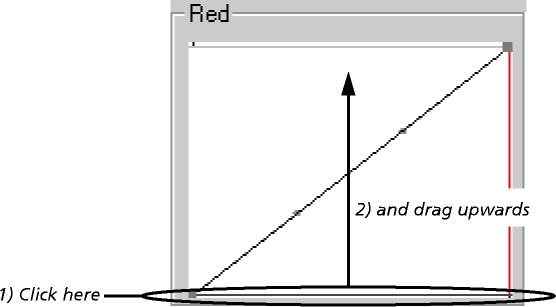
Afterwards, the graph looks like this:
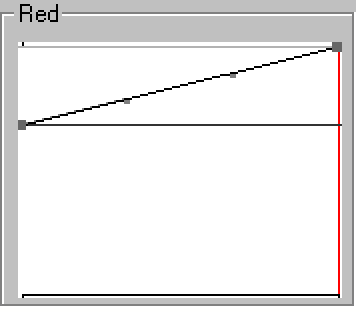
Note that a line remains at the bottom of the graph. This line shows the minimum value of the component that can be output (i.e. 0%), and was initially obscured by the brightness control, which lay on top of it. Similarly, there is another line at the top of the graph - initially obscured by the contrast control - which shows the full value of the component that can be output (i.e. 100%).
If necessary, you can drag the controls off the area of the graph. For example, to increase the red component's contrast:
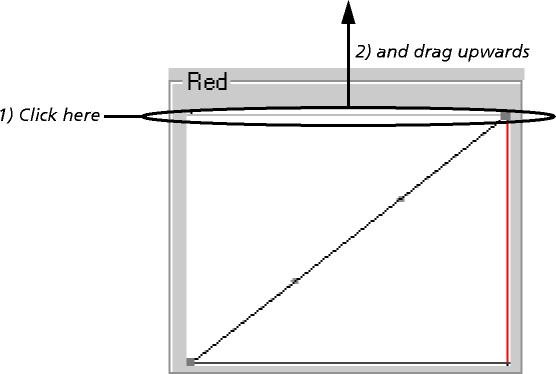
After you move the controls, the graph resizes to ensure that its controls and the graph itself always remain visible. The lines showing the maximum and minimum output values also move as necessary; any corrected values falling outside the range that can be output are clipped:
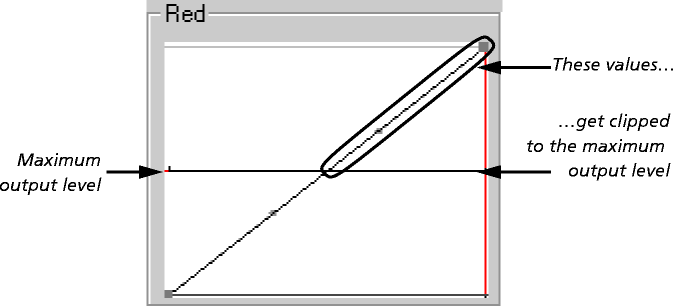
resulting in a correction like this:
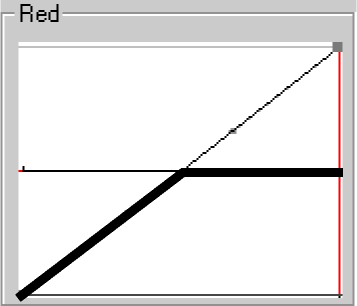
where all the red pixels that are originally more than 50% red become 100% red.